 Graphs plugin
Added by Brad Beattie about 17 years ago
Hey folks, I'm working on a graphs plugin for Redmine that augments the exiting SVG use (like in repository statistics). Attached is the first instance I've implemented: a graph of issues over time for a given target version.
Is there anything else anyone wants? These things seem relatively easy to implement.
| Screenshot-Schedules_Plugin_-_0.2.0_-_Project_Overview_-_Mozilla_Firefox.png (122 KB) Screenshot-Schedules_Plugin_-_0.2.0_-_Project_Overview_-_Mozilla_Firefox.png | Example of the graphs plugin |
Replies (104)
 RE: Graphs plugin
-
Added by Jerome Vanthournout about 17 years ago
RE: Graphs plugin
-
Added by Jerome Vanthournout about 17 years ago
Hi Brad,
Your Screenshot looks very promising.
I have listed below an non-exhaustive list of graph which would make sense for a tool like Redmine.- Graph of open/close issue per project/tracker.
- List of open/close issue per project/tracker.
- in the Issues window, based on the selected filters, display the repartition of issue based on a selected column.
- Add the possibility to define the start and end dates for the line graphs
If you already have a code available, I could test it in my environment.
RE: Graphs plugin
-
Added by Brad Beattie about 17 years ago
Jerome Vanthournout wrote:
Hi Brad,
Your Screenshot looks very promising.
I have listed below an non-exhaustive list of graph which would make sense for a tool like Redmine.
- Graph of open/close issue per project/tracker.
- List of open/close issue per project/tracker.
- in the Issues window, based on the selected filters, display the repartition of issue based on a selected column.
- Add the possibility to define the start and end dates for the line graphs
If you already have a code available, I could test it in my environment.
Hey hey. Attached is what I've been working on. It's fairly sparse, but it works. I'll create a github repository for this tonight so that you can add on to this.
Eric pointed out two other plugins that I missed:- http://github.com/mszczytowski/redmine_charts/tree/master (relies on Flash)
- http://github.com/scrumalliance/redmine_burndown/tree/master (relies on Google)
There's an advantage to a locally hosted solution, but SVG isn't supported in IE. I suppose it depends on your target audience. My motivation for going SVG is that Redmine's currently using it for Subversion charts. The plugin is, consequently, fairly small as it doesn't require any additional libraries.
RE: Graphs plugin
-
Added by Brad Beattie about 17 years ago
Jerome Vanthournout wrote:
- Graph of open/close issue per project/tracker.
- List of open/close issue per project/tracker.
- in the Issues window, based on the selected filters, display the repartition of issue based on a selected column.
- Add the possibility to define the start and end dates for the line graphs
Hrm. The graph that I created gave me info that Redmine had in its database, but wasn't initially accessible. The Report Summary built into redmine does takes care of your second point.
 RE: Graphs plugin
-
Added by Eric Davis about 17 years ago
RE: Graphs plugin
-
Added by Eric Davis about 17 years ago
Just tried it out on my development install and have a few suggestions
- Maybe have a graph for the entire project. That would pull in all the issues, even if they are not on a version.
- Hook into the Budget plugin and have a graph for each Deliverable.
- Add i18n strings for 0.8 (lang/..yml)
- Might want to extend the range of the graph out a few days on both sides. That way it will show the issues starting at 0 and work it way up over time.
- Not sure if you can with SVG but tooltips at each data point would be useful.
- Somehow one of my graphs shows more issues closed than reported. I've attached a screenshot and you can find the data on My Redmine.
- Where's the tests?
Once you get it on GitHub, I'll take a look at it and see if I can implement a few ideas.
Eric
RE: Graphs plugin
-
Added by Eric Davis about 17 years ago
Screenshots of bugs are easier to see when they are actually attached :)
Eric
| graphs_more_closed_than_total.png (73.4 KB) graphs_more_closed_than_total.png | Local graph of https://projects.littlestreamsoftware.com/versions/show/23 |
RE: Graphs plugin
-
Added by Brad Beattie about 17 years ago
Eric Davis wrote:
Just tried it out on my development install and have a few suggestions
- Maybe have a graph for the entire project. That would pull in all the issues, even if they are not on a version.
- Hook into the Budget plugin and have a graph for each Deliverable.
- Add i18n strings for 0.8 (lang/..yml)
- Might want to extend the range of the graph out a few days on both sides. That way it will show the issues starting at 0 and work it way up over time.
- Not sure if you can with SVG but tooltips at each data point would be useful.
- Somehow one of my graphs shows more issues closed than reported. I've attached a screenshot and you can find the data on My Redmine.
- Where's the tests?
Once you get it on GitHub, I'll take a look at it and see if I can implement a few ideas.
Eric
Kay, it's up on github:http://github.com/bradbeattie/redmine-graphs-plugin/tree/master.
I've fixed the bug you mentioned in point 6. It gives the graph a bit more of a plateau-ish curve, but it works. :)
As for the other points, I'll look into those.
RE: Graphs plugin
-
Added by Brad Beattie about 17 years ago
Eric Davis wrote:
Where's the tests?
Hrm... No idea how I'd go about testing SVG output. Any hints?
RE: Graphs plugin
-
Added by Brad Beattie about 17 years ago
Eric Davis wrote:
Maybe have a graph for the entire project. That would pull in all the issues, even if they are not on a version.
I don't have the necessary hooks to do that. I could create a patch that adds some hooks to the views. Alternatively, I could just overload the views with the plugin, although the former would be preferable. Would that be good with you?
Might want to extend the range of the graph out a few days on both sides. That way it will show the issues starting at 0 and work it way up over time.
The fix for your previously mentioned bug effectively did this.
- Not sure if you can with SVG but tooltips at each data point would be useful.
The timeseries example page shows what that library is capable of. As you can see, we can show the values for each data point. It looks a little cluttered that way. I see a separate site saying tooltips in SVG is doable, so I'll see if I can't get this working with the provided library.
RE: Graphs plugin
-
Added by Brad Beattie about 17 years ago
Brad Beattie wrote:
The timeseries example page shows what that library is capable of. As you can see, we can show the values for each data point. It looks a little cluttered that way. I see a separate site saying tooltips in SVG is doable, so I'll see if I can't get this working with the provided library.
Unfortunately, these tooltips only show the X axis and aren't extensible enough to show the Y. Boo. :(
 RE: Graphs plugin
-
Added by ciaran jessup about 17 years ago
RE: Graphs plugin
-
Added by ciaran jessup about 17 years ago
If anyone's interested I did a fork1 of the previously mentioned scrumalliance/ burndown charts that uses the 'flot' graphing library2. This library doesn't require flash, doesn't require svg, and works even in IE6, I'm particularly impressed by it!! (and unlike google charts works when you're behind the world's most frustrating office proxy!)
[1] http://github.com/ciaranj/redmine_burndown/tree/master
[2] http://code.google.com/p/flot/
RE: Graphs plugin
-
Added by Eric Davis about 17 years ago
Brad Beattie wrote:
Eric Davis wrote:
Where's the tests?
Hrm... No idea how I'd go about testing SVG output. Any hints?
How I would approach this would be to split out the SVG generator into a few methods:
- One to request the data needed (issue counts)
- One to calculate the graph data (3 issue open, 1 closed last Monday)
- One to actually render the SVG
Then, using mocks, you can test each part individually and also check edge case inputs (e.g. 0 issues). Finally, once you have the smaller methods tested you can easily do a few larger integration tests that just make sure "Given a request with data, a SVG is created correctly".
Eric
RE: Graphs plugin
-
Added by Brad Beattie about 17 years ago
Hrm. That's a neat library. That it works without SVG (supporting IE) is a sweet bonus.
I'd be curious to see Redmine's internal graphing done with this first. I guess my primary concern here is having multiple graphing solutions in one instance, y'know? If Redmine used Flot for its graphing, then I'd be 100% on board with Flot plugins. Otherwise you end up with "Yeah, you can look at the repository statistics in any browser except FireFox, but the other graphs are always active." Good luck explaining that to an end-user. ;)
RE: Graphs plugin
-
Added by ciaran jessup about 17 years ago
;) I can relate to that <g> I did start off with an SVG approach for a work project, but the IE pain made me look elsewhere, there's some particularly nice forks of flot hanging around on GitHub providing pie charts and side-on bar charts, it is quite a nice polished library all things considered!
RE: Graphs plugin
-
Added by Brad Beattie about 17 years ago
Eric Davis wrote:
Maybe have a graph for the entire project. That would pull in all the issues, even if they are not on a version.
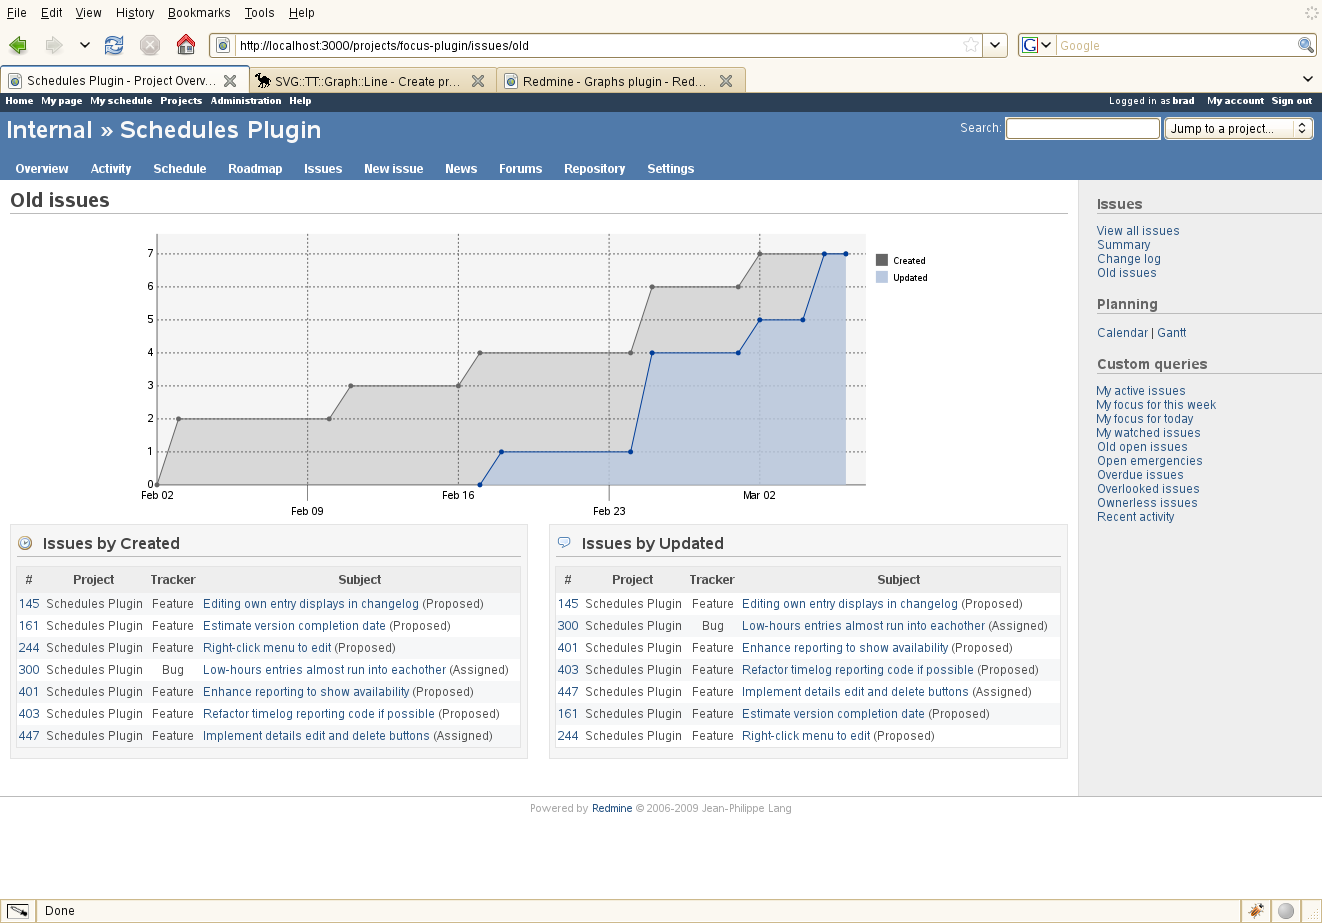
I've added a new graph page that shows old issues. It's similar to the target version graph, but it doesn't show total vs open issues. Instead, it shows created vs updated dates on all open issues.
I thought about showing closed issues for a project (or globally), but if a project is several years old, that graph is going to by mighty busy and I'm not sure what information could be gleaned from the data. In contrast, the old issues graph I've added highlights the dust that's building in your project, old issues that aren't getting much love.
| old_issues.png (143 KB) old_issues.png |
RE: Graphs plugin
-
Added by Jerome Vanthournout about 17 years ago
Hi Brad,
I have installed your plugin on Redmine v0.8.1. Based on what I understand, when a revision is displayed, the plugin is supposed to show the associated graph. Unfortunately, when I click on the revision, I get the following error :
*Internal error*

An error occurred on the page you were trying to access.
The error reported by the server is :
ActionView::TemplateError (Missing host to link to! Please provide :host parameter or set default_url_options[:host]) on line #48 of versions/show.rhtml:
45: <% end %>
46: </div>
47:
48: <%= call_hook :view_versions_show_bottom, :version => @version %>
49:
50: <% html_title @version.name %>

    vendor/rails/actionpack/lib/action_controller/url_rewriter.rb:61:in `url_for'
    vendor/plugins/redmine_graphs/lib/target_version_graph_hook.rb:5:in `view_versions_show_bottom'
    lib/redmine/hook.rb:60:in `send'
    lib/redmine/hook.rb:60:in `call_hook'
    lib/redmine/hook.rb:59:in `each'
    lib/redmine/hook.rb:59:in `call_hook'
    lib/redmine/hook.rb:104:in `call_hook'
    app/views/versions/show.rhtml:48:in `_run_erb_47app47views47versions47show46rhtml'
Did I miss something during the installation ?
Thanks in advance.
 RE: Graphs plugin
-
Added by Mischa The Evil about 17 years ago
RE: Graphs plugin
-
Added by Mischa The Evil about 17 years ago
Jerome Vanthournout wrote:
I have installed your plugin on Redmine v0.8.1. Based on what I understand, when a revision is displayed, the plugin is supposed to show the associated graph. Unfortunately, when I click on the revision, I get the following error :
[...]
The error reported by the server is :
[...]
Did I miss something during the installation ?
I came around this too. It could be fixed with the info provided in this blogpost (Create a link inside a Redmine hook) of Eric Davis.
Changing line 6 in ../vendor/plugins/redmine_graphs/lib/target_version_graph_hook.rb from:
output << tag("embed", :width => "100%", :height => 300, :type => "image/svg+xml", :src => url_for(:controller => 'graphs', :action => 'target_version', :id => context[:version]))to:
output << tag("embed", :width => "100%", :height => 300, :type => "image/svg+xml", :src => url_for(:controller => 'graphs', :action => 'target_version', :id => context[:version], :host => Setting.host_name, :protocol => Setting.protocol))or to:
output << tag("embed", :width => "100%", :height => 300, :type => "image/svg+xml", :src => url_for(:controller => 'graphs', :action => 'target_version', :id => context[:version], :only_path => true))solves the issue...
HTH and greetings,
Mischa.
RE: Graphs plugin
-
Added by Brad Beattie about 17 years ago
Eric Davis wrote:
Maybe have a graph for the entire project. That would pull in all the issues, even if they are not on a version.
Added a graph to show the growth of the top 6 projects in a Redmine instance.
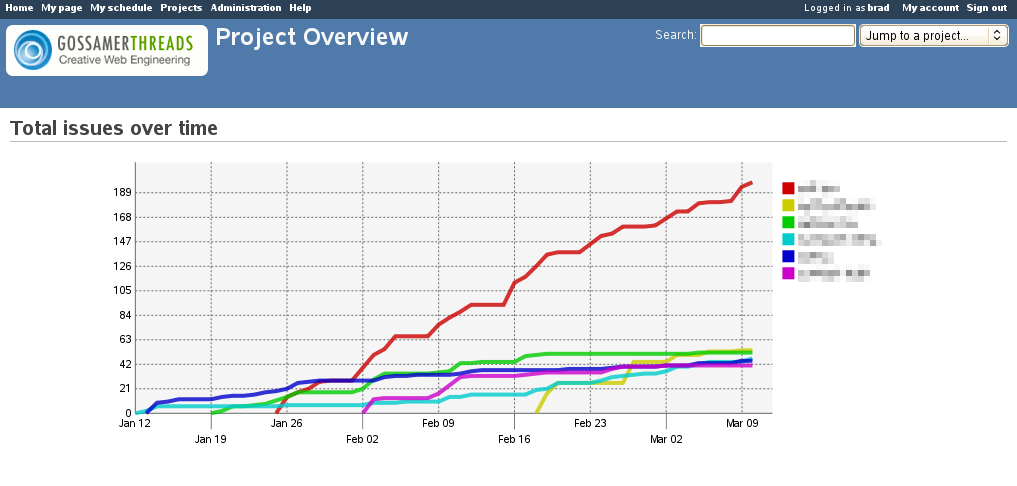
RE: Graphs plugin
-
Added by Brad Beattie about 17 years ago
First release attached...
| redmine_graphs.tgz (11.2 KB) redmine_graphs.tgz | 0.1.0 release |
RE: Graphs plugin
-
Added by Mischa The Evil about 17 years ago
Brad Beattie wrote:
First release attached...
This seems to become a great plugin for Redmine... I've tested it on Redmine trunk at r2641 and have found that both the issuelist-graphs aren't rendered correctly. I've posted the details in another forum-thread: http://www.redmine.org/boards/3/topics/5090
The earlier mentioned error regarding the missing :only_path-parameter doesn't seem to happen on the current trunk.
HTH...
RE: Graphs plugin
-
Added by Brad Beattie about 17 years ago
Mischa The Evil wrote:
This seems to become a great plugin for Redmine... I've tested it on Redmine trunk at r2641 and have found that both the issuelist-graphs aren't rendered correctly. I've posted the details in another forum-thread: http://www.redmine.org/boards/3/topics/5090
The earlier mentioned error regarding the missing
:only_path-parameter doesn't seem to happen on the current trunk.
Hrm. Odd as I can't replicate this error in my instance. Is there anything unusual about your setup that might be related?
RE: Graphs plugin
-
Added by Mischa The Evil about 17 years ago
Brad Beattie wrote:
What precise error do mean with that:Hrm. Odd as I can't replicate this error in my instance.
- error regarding the missing :only_path-parameter?
- error described at http://www.redmine.org/boards/3/topics/5090?
Brad Beattie wrote:
Is there anything unusual about your setup that might be related?
The only thing I can think of is my MySQL-version. It's still on 4.x... I've had some more problems with it with the Charts-plugin. Also the current trunk isn't fully MySQL 4.x-compatible (see defect #2755).
 RE: Graphs plugin
-
Added by Chaoqun Zou about 17 years ago
RE: Graphs plugin
-
Added by Chaoqun Zou about 17 years ago
Hi, Brad
The plugin looks great. And here is a small suggestion: It would be better to make the sidebar menu "Graphs" to a localizable string.
RE: Graphs plugin
-
Added by Chaoqun Zou about 17 years ago
Chaoqun Zou wrote:
Hi, Brad
The plugin looks great. And here is a small suggestion: It would be better to make the sidebar menu "Graphs" to a localizable string.
And it would be better to make the issue menu selected in old and growth page.
RE: Graphs plugin
-
Added by Brad Beattie about 17 years ago
Chaoqun Zou wrote:
Hi, Brad
The plugin looks great. And here is a small suggestion: It would be better to make the sidebar menu "Graphs" to a localizable string.
Done.
RE: Graphs plugin
-
Added by Brad Beattie about 17 years ago
Chaoqun Zou wrote:
And it would be better to make the issue menu selected in old and growth page.
Not sure how. Point to some example code or make a pull request on Github?