Defect #40728
closed
Slow loading of global spent time list in MySQL
Description
While loading the global spent time the website is taking too long to respond, usually taking more than 3 minutes. sometimes it doesn’t even load the data.
Environment:
Redmine version 5.1.2.stable
Ruby version 3.2.4-p170 (2024-04-23) [x86_64-linux]
Rails version 6.1.7.7
Environment production
Database adapter Mysql2
Mailer queue ActiveJob::QueueAdapters::SidekiqAdapter
Mailer delivery smtp
Redmine settings:
Redmine theme Zenmine-510 (includes JavaScript)
SCM:
Subversion 1.14.2
Mercurial 6.3.2
Bazaar 3.3.2
Git 2.39.2
Filesystem
Redmine plugins:
redmine_agile 1.6.9
redmine_budgets 1.0.5
redmine_checklists 3.1.23
redmine_contacts 4.4.1
redmine_contacts_helpdesk 4.2.2
redmine_contacts_invoices 4.2.9
redmine_reporter 2.0.4
Files
Related issues
 Updated by Holger Just almost 2 years ago
- Status changed from New to Needs feedback
There is a limit on the number of time entries displayed per page. The available values can be set by admins and should be set to reasonable values. Redmine is not intended to show thousands of entries per page and slowdowns or timeouts are expected in this case. A reasonable max number of 100 entries per page. Thus, make sure you have configured reasonable per page limits in Administration -> Settings -> General -> Objects per page options.
If these values are reasonable in your case, we need more information about your Redmine and the amount of data which may allow us to reproduce this.
 Updated by Kaustubh Patil almost 2 years ago
Hello Holger, we are aware about the same and i.e why we have kept objects per page and search results per page to a limit of 25. I would also like to highlight that the mentioned issue is only observed in the root user. For non-admin users the global spent time loads seamlessly.
Updated by Holger Just almost 2 years ago
In that case, please provide additional information which allows us to reproduce this issue:
- How many time entries are there overall?
- Are you using filters? Are you using a lot of custom fields?
- Check your Redmine logs in
logs/production.logon your server. I possible, try to raise the log level before trying by editingconfig/additional_environment.rb. There is an example file namedconfig/additional_environment.rb.example. Check for any long-running SQL statements.
You are using a lot of plugins which may change behavior in this area of code. Try if you can reproduce this issue after you have disabled all plugins. You can also contact the plugin authors if they change anything in the area of time entries.
 Updated by Yuvansri Thangavel about 1 year ago
Hi Holger,
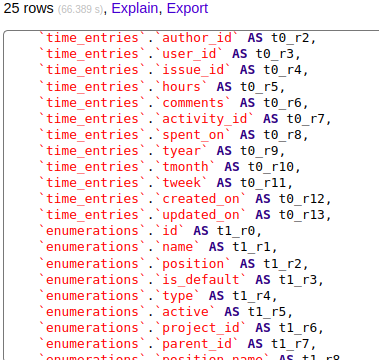
I have face the same issue, after removing all the plugins. So i enable the debug log. Then i found Two of the queries taking more time.
1)
SELECT
    `time_entries`.`id` AS t0_r0,
    `time_entries`.`project_id` AS t0_r1,
    `time_entries`.`author_id` AS t0_r2,
    `time_entries`.`user_id` AS t0_r3,
    `time_entries`.`issue_id` AS t0_r4,
    `time_entries`.`hours` AS t0_r5,
    `time_entries`.`comments` AS t0_r6,
    `time_entries`.`activity_id` AS t0_r7,
    `time_entries`.`spent_on` AS t0_r8,
    `time_entries`.`tyear` AS t0_r9,
    `time_entries`.`tmonth` AS t0_r10,
    `time_entries`.`tweek` AS t0_r11,
    `time_entries`.`created_on` AS t0_r12,
    `time_entries`.`updated_on` AS t0_r13,
    `enumerations`.`id` AS t1_r0,
    `enumerations`.`name` AS t1_r1,
    `enumerations`.`position` AS t1_r2,
    `enumerations`.`is_default` AS t1_r3,
    `enumerations`.`type` AS t1_r4,
    `enumerations`.`active` AS t1_r5,
    `enumerations`.`project_id` AS t1_r6,
    `enumerations`.`parent_id` AS t1_r7,
    `enumerations`.`position_name` AS t1_r8
FROM
    `time_entries`
    INNER JOIN `projects` ON `projects`.`id` = `time_entries`.`project_id`
    INNER JOIN `enumerations` ON `enumerations`.`id` = `time_entries`.`activity_id`
    AND `enumerations`.`type` = 'TimeEntryActivity'
    INNER JOIN `users` ON `users`.`id` = `time_entries`.`user_id`
    AND `users`.`type` IN ('User', 'AnonymousUser')
    LEFT OUTER JOIN issues ON issues.id = time_entries.issue_id
    AND (
        projects.status <> 9
        AND projects.status <> 10
        AND EXISTS (
            SELECT
                1 AS one
            FROM
                enabled_modules em
            WHERE
                em.project_id = projects.id
                AND em.name = 'issue_tracking'
        )
    )
WHERE
    (
        projects.status <> 9
        AND projects.status <> 10
        AND EXISTS (
            SELECT
                1 AS one
            FROM
                enabled_modules em
            WHERE
                em.project_id = projects.id
                AND em.name = 'time_tracking'
        )
    )
    AND (
        enumerations.project_id = time_entries.project_id
        AND enumerations.project_id = projects.id
        OR enumerations.project_id IS NULL
    )
ORDER BY
    time_entries.spent_on DESC,
    time_entries.created_on DESC,
    time_entries.id ASC
LIMIT
    25 OFFSET 0
2)
SELECT
    SUM(`time_entries`.`hours`)
FROM
    `time_entries`
    INNER JOIN `projects` ON `projects`.`id` = `time_entries`.`project_id`
    INNER JOIN `enumerations` ON `enumerations`.`id` = `time_entries`.`activity_id`
    AND `enumerations`.`type` = 'TimeEntryActivity'
    INNER JOIN `users` ON `users`.`id` = `time_entries`.`user_id`
    AND `users`.`type` IN ('User', 'AnonymousUser')
    LEFT OUTER JOIN issues ON issues.id = time_entries.issue_id
    AND (
        projects.status <> 9
        AND projects.status <> 10
        AND EXISTS (
            SELECT
                1 AS one
            FROM
                enabled_modules em
            WHERE
                em.project_id = projects.id
                AND em.name = 'issue_tracking'
        )
    )
WHERE
    (
        projects.status <> 9
        AND projects.status <> 10
        AND EXISTS (
            SELECT
                1 AS one
            FROM
                enabled_modules em
            WHERE
                em.project_id = projects.id
                AND em.name = 'time_tracking'
        )
    )
    AND (
        enumerations.project_id = time_entries.project_id
        AND enumerations.project_id = projects.id
        OR enumerations.project_id IS NULL
    )
 Updated by Go MAEDA about 1 year ago
Yuvansri Thangavel, could you please tell me how many records are in the time_entries table and the projects table?
Updated by Yuvansri Thangavel about 1 year ago
Go MAEDA wrote in #note-5:
Yuvansri Thangavel, could you please tell me how many records are in the time_entries table and the projects table?
HI Go MAEDA,
I have only 331505.
Updated by Yuvansri Thangavel about 1 year ago
- File explain_query.png explain_query.png added
- File time_taken.png time_taken.png added
I have face this in load, only login as an admin.
For your reference, I attach the time_taken, explain query shot.
Updated by Yuvansri Thangavel about 1 year ago
Updated by Yuvansri Thangavel about 1 year ago
@Go MAEDA,
Hello, currently we are upgrading redmine 6.0.2. From that we have face this issue.
Updated by Yuvansri Thangavel about 1 year ago
Could you please look at this one.
Thank you,
Updated by Holger Just about 1 year ago
Please add what database and version you are using. Since the query is executed on the database server, this is likely dependent on the exact software used here.
Updated by Yuvansri Thangavel about 1 year ago
Hi Holger,
Actually previously we us 5.XX version of mysql. Now we upgrade this to 8.0.37.
Updated by Yuvansri Thangavel about 1 year ago
one more thing we're using AWS - RDS.
Updated by Yuvansri Thangavel about 1 year ago
When i remove "AND projects.status <> 10" from the query. It's executed quickly
Updated by Go MAEDA about 1 year ago
Yuvansri Thangavel wrote in #note-14:
When i remove "AND projects.status <> 10" from the query. It's executed quickly
Thank you for sharing that information.
Could you try testing the following two versions of the SQL statement to see if they resolve the performance issue?
1. A version that replaces all occurrences of projects.status <> 9 AND projects.status <> 10 with projects.status NOT IN (9, 10).
2. A version that replaces all occurrences of projects.status <> 9 AND projects.status <> 10 with projects.status IN (1, 5).
Updated by Yuvansri Thangavel about 1 year ago
1. takes more time when adding status 10. --> 160.384 sec
2. Runs quickly. 1.25 to 1.9 sec
I found there is no projects, mapped as status 10, in projects table.
Updated by Go MAEDA about 1 year ago
- File 40728.patch 40728.patch added
- Category set to Performance
- Status changed from Needs feedback to Confirmed
- Target version set to Candidate for next minor release
Thanks to Yuvansri Thangavel's investigation, the solution to this performance issue has been identified.
The attached patch resolves the issue by replacing the SQL condition projects.status <> 9 AND projects.status <> 10, generated by Project.allowed_to_condition method, with faster projects.status IN (1, 5). Since the possible values for projects.status are only 1, 5, 9, and 10, both conditions will return the same rows.
Although both conditions returns same result, projects.status IN (1, 5) is more efficient than projects.status <> 9 AND projects.status <> 10. This is likely because <> operator creates a range condition that MySQL struggles to optimize efficiently, often leading to a full table scan. In contrast, IN (1, 5) explicitly specifies target values, allowing MySQL to filter rows more effectively.
Updated by Yuvansri Thangavel about 1 year ago
- File explain_for_enum.png explain_for_enum.png added
Hi Go MAEDA,
Thanks for the patch. I have updated the code.
1. Time entry count query issues has been resolved.
2. But, another two queriesa. Sum of time entries
b. Time entry details fetch query
Both queries still takes more time.
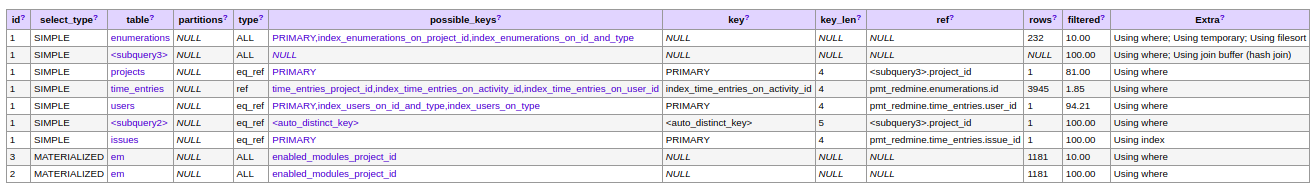
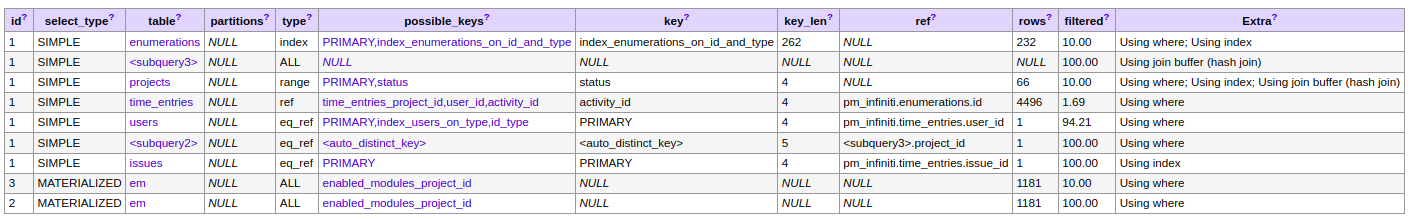
I have validate those queries EXPLAIN.
when, i remove where clause query gets executed quickly.(I know the where clause is important to validate the module is enabled for the project).
In JOIN clauses, The query validates issue_tracking module is enabled or not.
again in WHERE Clause, The validation happens for time_tracking module.
In this case, when join exec happens 4496 columns filtered
when exec move to LEFT OUTER JOIN, issue_tracking module validation. 1181 rows get filtered.
Now in where clause another 1181 again.
(4496 * 1181 * 1181) now of rows examined in query is inceased.
Updated by Yuvansri Thangavel about 1 year ago
Now, i'm working on default global spent time filter. when, user clicks global spent time menu they can only view today and past 30 days time entries. so it reduce the rows in query. If user wants to see all the time entries they should need change the Date filter. (This not a permanent one.). can you suggest it's good one.
Updated by Go MAEDA about 1 year ago
Yuvansri Thangavel wrote in #note-18:
Hi Go MAEDA,
Thanks for the patch. I have updated the code.
1. Time entry count query issues has been resolved.
2. But, another two queriesa. Sum of time entries
b. Time entry details fetch query
Both queries still takes more time.
I have validate those queries EXPLAIN.
when, i remove where clause query gets executed quickly.(I know the where clause is important to validate the module is enabled for the project).
In JOIN clauses, The query validates issue_tracking module is enabled or not.
again in WHERE Clause, The validation happens for time_tracking module.
In this case, when join exec happens 4496 columns filtered
when exec move to LEFT OUTER JOIN, issue_tracking module validation. 1181 rows get filtered.
Now in where clause another 1181 again.
(4496 * 1181 * 1181) now of rows examined in query is inceased.
Thank you for your feedback.
Could you please open separate two new issues for the two problems?
They are separate issues from the issues resolved in #note-17, and handling them in this issue will prevent #note-17 fixes from being quickly delivered in upcoming releases.
Updated by Yuvansri Thangavel about 1 year ago
Hi Go MAEDA,
I have created two new issues.
1. Defect #42202: SUM of time entries query load issue
2. Defect #42203: Time entry details fetch query load issue
Updated by Go MAEDA about 1 year ago
Yuvansri Thangavel wrote in #note-21:
Hi Go MAEDA,
I have created two new issues.
1. 42202
2. 42203
Thank you, I will take a look.
Updated by Go MAEDA 12 months ago
- File 40728-v2.patch 40728-v2.patch added
- Subject changed from Global Spent Time Loading Issue after Redmine Enhancement to Slow loading of global spent time list in MySQL
I am posting an updated patch with a new approach. It should also fixes #42202 and #42203.
I was able to reproduce the issue in my development environment. This performance problem occurs only with MySQL. It has not been observed with PostgreSQL or SQLite. I tested with MySQL 9.2.0, using data that includes 200 projects and 600,000 time entries. In the current trunk (r23598), running the following line in TimeLogController#index took about 150 seconds to execute.
@entries = scope.offset(@entry_pages.offset).limit(@entry_pages.per_page).to_a
The patch I posted in #note-17 does not completely fix the issue. After applying the patch in #note-17, the response time initially improved to 2 seconds, and it seemed like the issue was resolved. However, when I tested again later, the same request took about 150 seconds, even with the patch applied. I suspect that something changed in MySQL, and the optimizer started choosing a different execution plan for the same SQL query.
During further investigation, I found that the join order selected by MySQL's optimizer had a big impact on performance. To address this, I added an optimizer hint to the SELECT statement to control the join order. With this change, performance became consistently good.
The current trunk:
  SQL (148288.0ms)  SELECT `time_entries`.`id` AS t0_r0, `time_entries`.`project_id` AS t0_r1, `time_entries`.`author_id` AS t0_r2, `time_entries`.`user_id` AS t0_r3, `time_entries`.`issue_id` AS t0_r4, `time_entries`.`hours` AS t0_r5, `time_entries`.`comments` AS t0_r6, `time_entries`.`activity_id` AS t0_r7, `time_entries`.`spent_on` AS t0_r8, `time_entries`.`tyear` AS t0_r9, `time_entries`.`tmonth` AS t0_r10, `time_entries`.`tweek` AS t0_r11, `time_entries`.`created_on` AS t0_r12, `time_entries`.`updated_on` AS t0_r13, `enumerations`.`id` AS t1_r0, `enumerations`.`name` AS t1_r1, `enumerations`.`position` AS t1_r2, `enumerations`.`is_default` AS t1_r3, `enumerations`.`type` AS t1_r4, `enumerations`.`active` AS t1_r5, `enumerations`.`project_id` AS t1_r6, `enumerations`.`parent_id` AS t1_r7, `enumerations`.`position_name` AS t1_r8 FROM `time_entries` INNER JOIN `projects` ON `projects`.`id` = `time_entries`.`project_id` INNER JOIN `users` ON `users`.`id` = `time_entries`.`user_id` AND `users`.`type` = 'User' LEFT OUTER JOIN `enumerations` ON `enumerations`.`id` = `time_entries`.`activity_id` AND `enumerations`.`type` = 'TimeEntryActivity' LEFT OUTER JOIN issues ON issues.id = time_entries.issue_id AND (projects.status <> 9 AND projects.status <> 10 AND EXISTS (SELECT 1 AS one FROM enabled_modules em WHERE em.project_id = projects.id AND em.name='issue_tracking')) WHERE (projects.status <> 9 AND projects.status <> 10 AND EXISTS (SELECT 1 AS one FROM enabled_modules em WHERE em.project_id = projects.id AND em.name='time_tracking')) ORDER BY time_entries.spent_on DESC, time_entries.created_on DESC, time_entries.id ASC LIMIT 25 OFFSET 0
  ↳ app/controllers/timelog_controller.rb:54:in `block (2 levels) in index'
With the patch applied:
  SQL (2021.1ms)  SELECT /*+ JOIN_ORDER(time_entries,projects,users) */ `time_entries`.`id` AS t0_r0, `time_entries`.`project_id` AS t0_r1, `time_entries`.`author_id` AS t0_r2, `time_entries`.`user_id` AS t0_r3, `time_entries`.`issue_id` AS t0_r4, `time_entries`.`hours` AS t0_r5, `time_entries`.`comments` AS t0_r6, `time_entries`.`activity_id` AS t0_r7, `time_entries`.`spent_on` AS t0_r8, `time_entries`.`tyear` AS t0_r9, `time_entries`.`tmonth` AS t0_r10, `time_entries`.`tweek` AS t0_r11, `time_entries`.`created_on` AS t0_r12, `time_entries`.`updated_on` AS t0_r13, `enumerations`.`id` AS t1_r0, `enumerations`.`name` AS t1_r1, `enumerations`.`position` AS t1_r2, `enumerations`.`is_default` AS t1_r3, `enumerations`.`type` AS t1_r4, `enumerations`.`active` AS t1_r5, `enumerations`.`project_id` AS t1_r6, `enumerations`.`parent_id` AS t1_r7, `enumerations`.`position_name` AS t1_r8 FROM `time_entries` INNER JOIN `projects` ON `projects`.`id` = `time_entries`.`project_id` INNER JOIN `users` ON `users`.`id` = `time_entries`.`user_id` AND `users`.`type` IN ('User', 'AnonymousUser') LEFT OUTER JOIN `enumerations` ON `enumerations`.`id` = `time_entries`.`activity_id` AND `enumerations`.`type` = 'TimeEntryActivity' LEFT OUTER JOIN issues ON issues.id = time_entries.issue_id AND (projects.status <> 9 AND projects.status <> 10 AND EXISTS (SELECT 1 AS one FROM enabled_modules em WHERE em.project_id = projects.id AND em.name='issue_tracking')) WHERE (projects.status <> 9 AND projects.status <> 10 AND EXISTS (SELECT 1 AS one FROM enabled_modules em WHERE em.project_id = projects.id AND em.name='time_tracking')) ORDER BY time_entries.spent_on DESC, time_entries.created_on DESC, time_entries.id ASC LIMIT 25 OFFSET 0
  ↳ app/controllers/timelog_controller.rb:54:in `block (2 levels) in index'
Updated by Go MAEDA 12 months ago
- Related to Defect #42202: SUM of time entries query load issue added
- Related to Defect #42203: Time entry details fetch query load issue added