Plugins Directory » ANKO Gantt chart
|
|
Author: | anko soft |
|---|---|---|
| Website: | http://www.ankosoft.co.jp/anko_gantt_chart/ | |
| Code repository: | - | |
| Registered on: | 2015-10-08 (almost 10 years ago) | |
| Current version: | 3.2.24 | |
| Compatible with: | Redmine 6.0.x, 5.1.x, 5.0.x, 4.2.x, 4.1.x, 4.0.x | |
| User ratings: |
Effortless Project Planning with ANKO Gantt Chart
Tired of switching pages just to create or update issues in Redmine’s default Gantt chart?
With ANKO Gantt Chart, you can create, edit, and manage your WBS and schedule — all directly from the Gantt chart view.
No more inefficiencies.
Experience intuitive, stress-free project management with powerful features designed for productivity.

Features:
- Register a new issue
- Register a subtask
- Change start and due dates by clicking the calendar
- Change start and due dates by dragging with the mouse
- Edit issue contents
- Display workflows
- Provide a rich and intuitive UI
- Display scheduled start and due dates clearly
- Set parent issues or versions by dragging with the mouse
- Adjust the width of the issue title, date, and assignee columns
- Open or close the issue tree view
- Automatically scroll the Gantt chart's date header
- Enable full-screen mode
- Set the default tracker
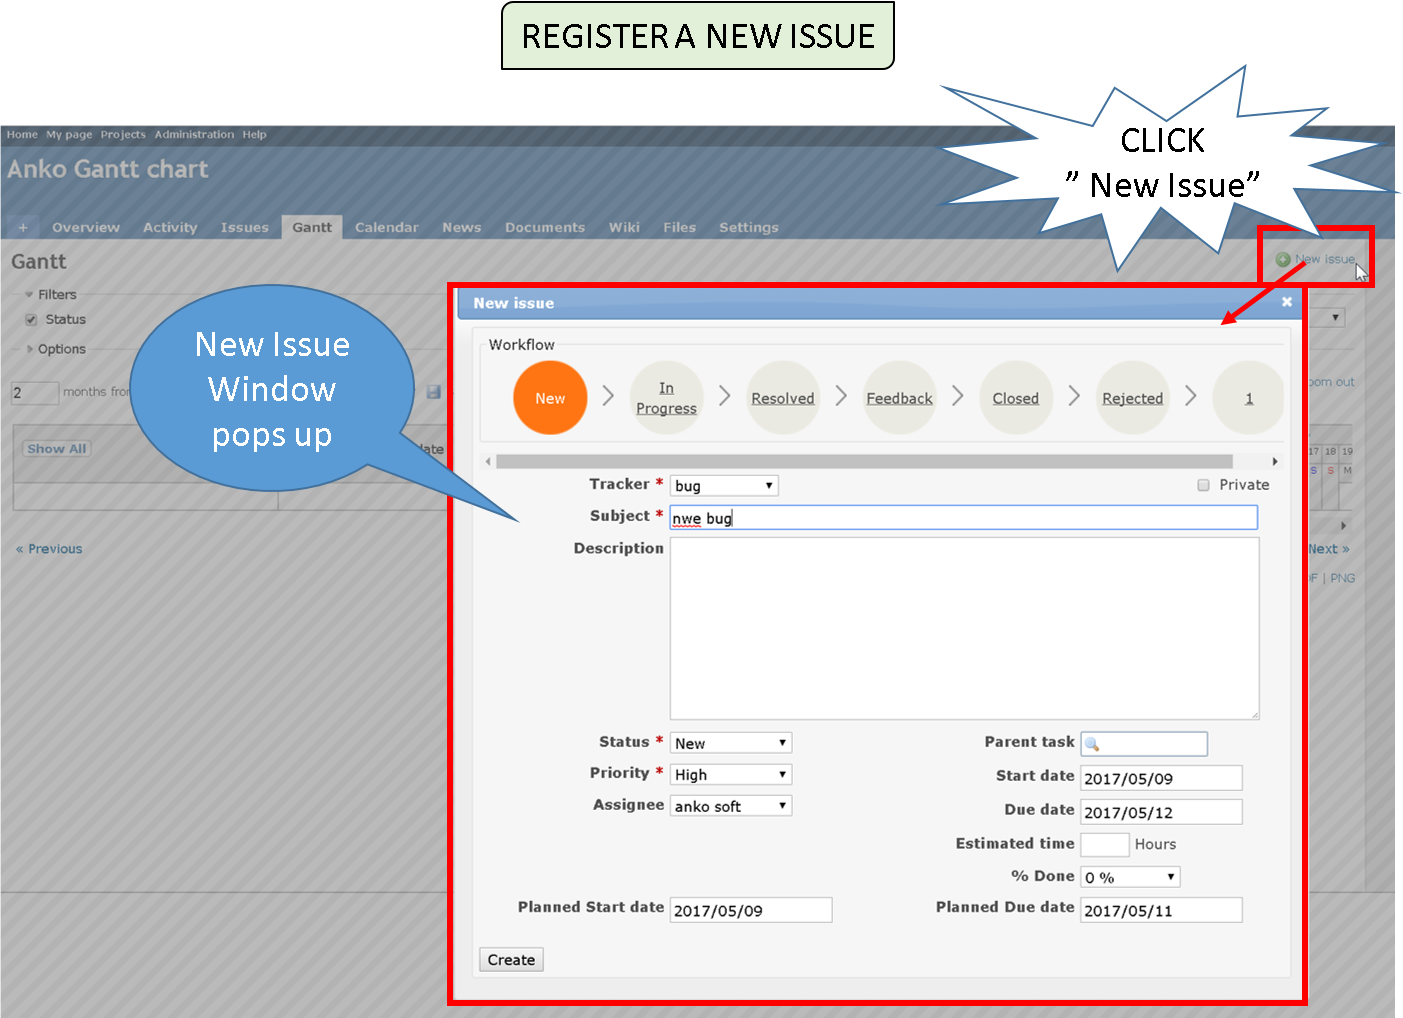
REGISTER A NEW ISSUE
You can create a new issue directly from the Gantt chart page by clicking “New Issue,” without navigating to a separate screen.
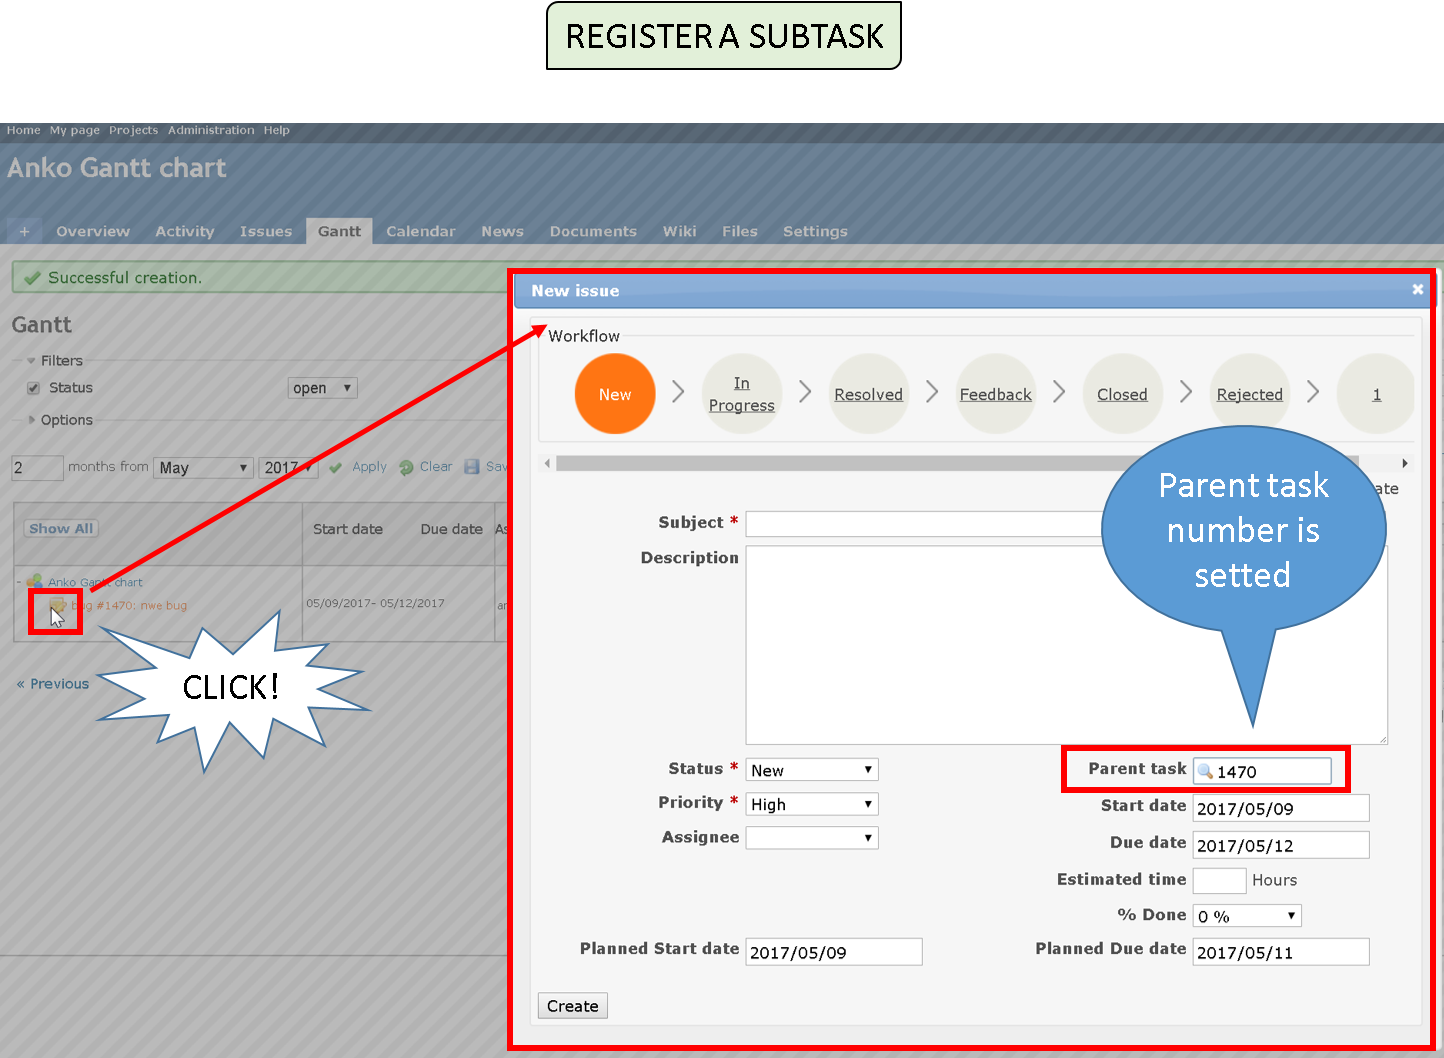
REGISTER A SUBTASK
You can easily create a subtask by clicking the pencil icon next to the issue name. The parent task field is automatically filled, allowing you to build a hierarchical structure like a WBS.
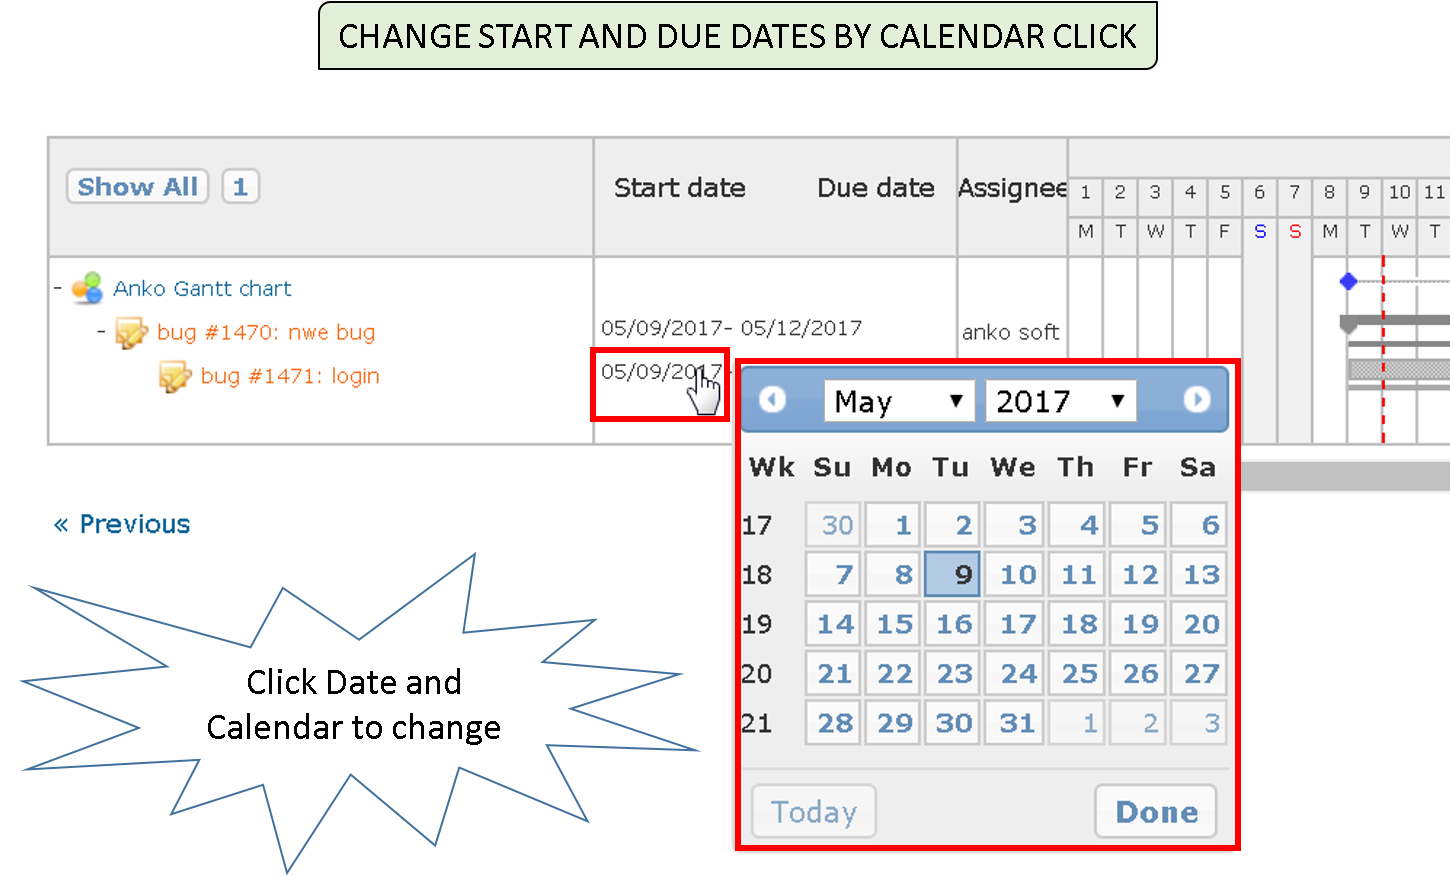
CHANGE START AND DUE DATES BY CALENDAR CLICK
Start and Due dates are shown at right of the issue name to check Start and Due dates. So it’s very convenient.
Click on the start or due date to open a calendar and easily select new dates.
Even when making frequent changes, you can update individual issue schedules quickly and easily — and see the results reflected immediately on the Gantt chart.
 !
!
CHANGE START AND DUE DATES BY MOUSE DRAG
You can adjust start and due dates by dragging tasks directly on the Gantt chart. The task bar becomes semi-transparent while dragging, allowing easy comparison with the original schedule.
 !
!
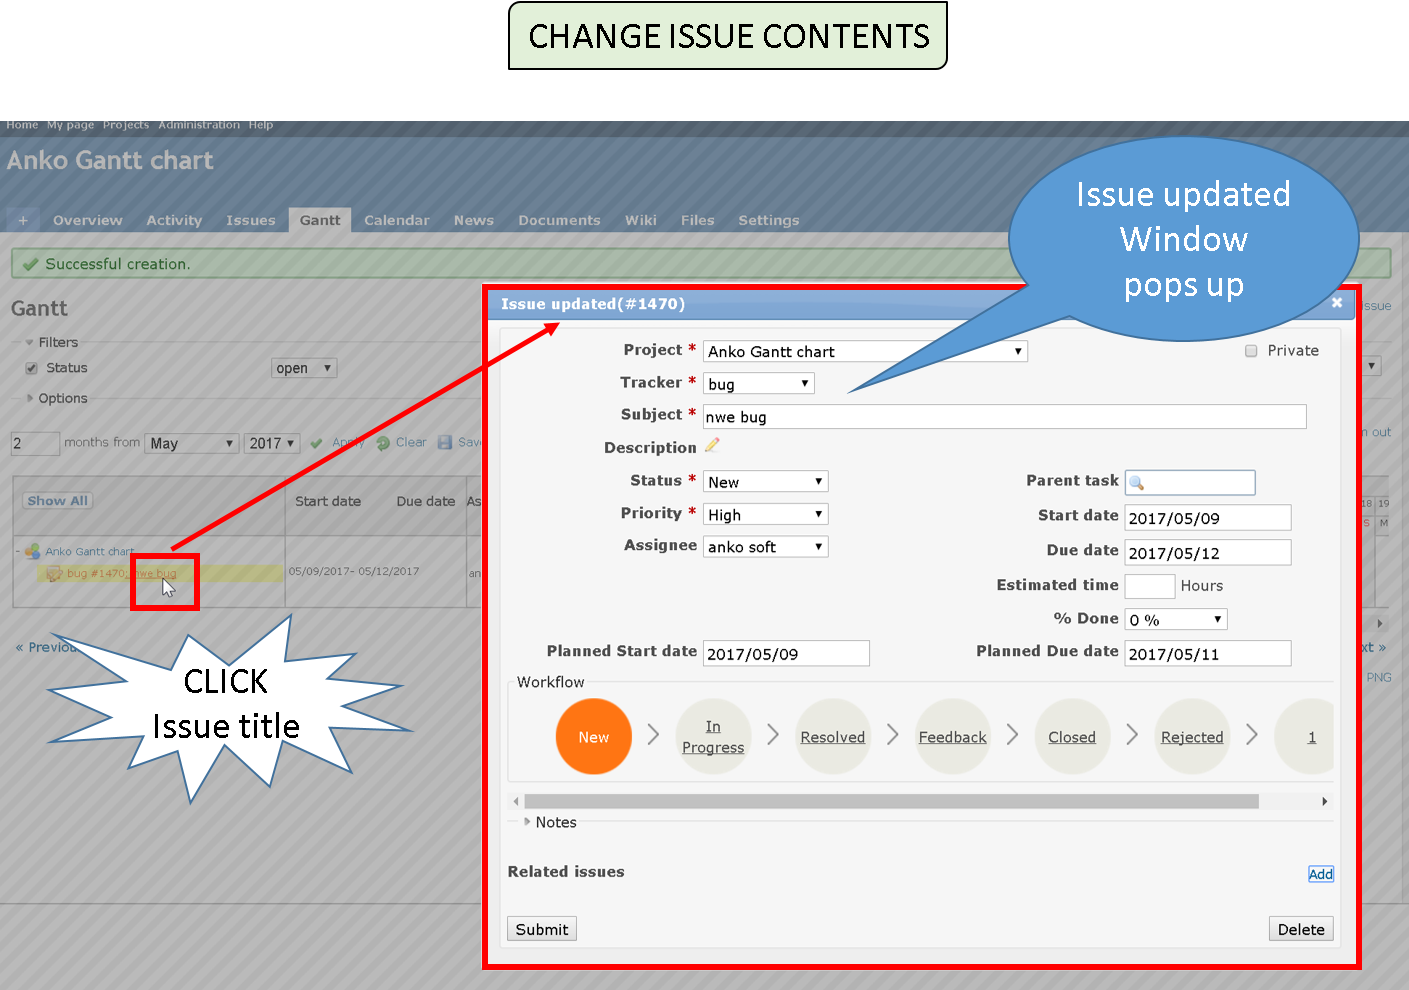
CHANGE ISSUE CONTENTS
In the default Redmine Gantt chart, editing required moving to the issue detail page and then returning. With ANKO Gantt Chart, you can update issue title, content, status, and relations directly from the Gantt view.
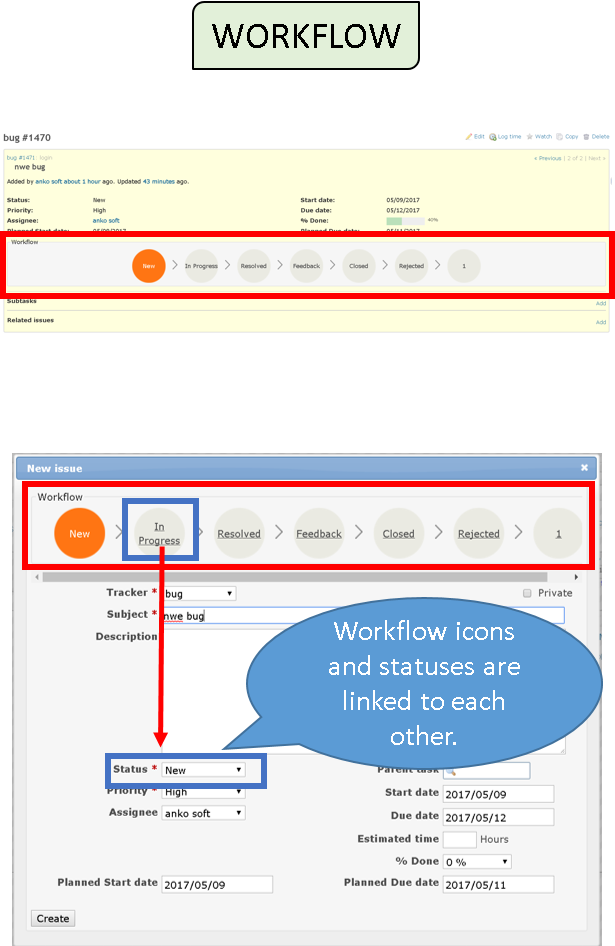
DISPLAY WORKFLOW
We provide a workflow display function that can visually confirm the status of the issue.
You can easily grasp what the next status is without having to click the status select box.
You can visually check the issue's current status and next possible transitions without opening a dropdown menu.
RICH UI
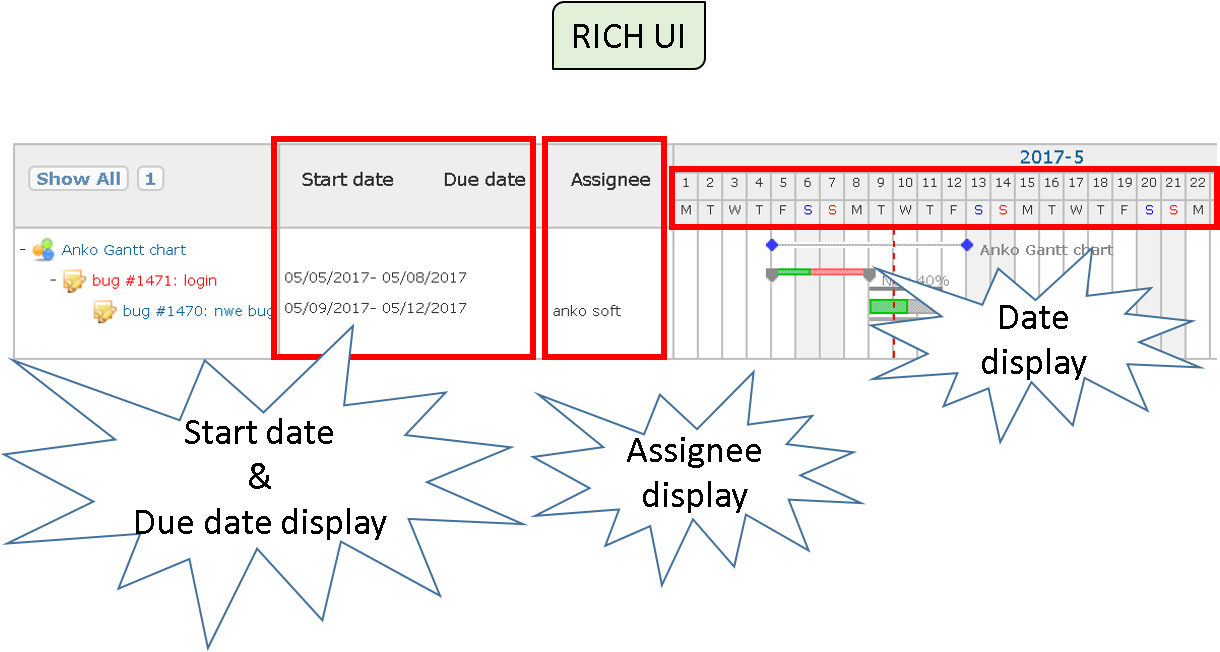
You can check the most important information of “when”, “who”, and “what” in project schedule management on Gantt chart page.
· “Start date” and “due date” are displayed to the right of the issue name as information on “WHEN”.
Even when the Gantt bars are hidden, you can still view start and due dates next to the issue name.
In addition, since DAY is displayed on the day of the week, it is possible to intuitively grasp the schedule.
· “Assignee” is displayed as information on “WHO”.
SCHEDULED START AND DUE OF DATE INDICATED
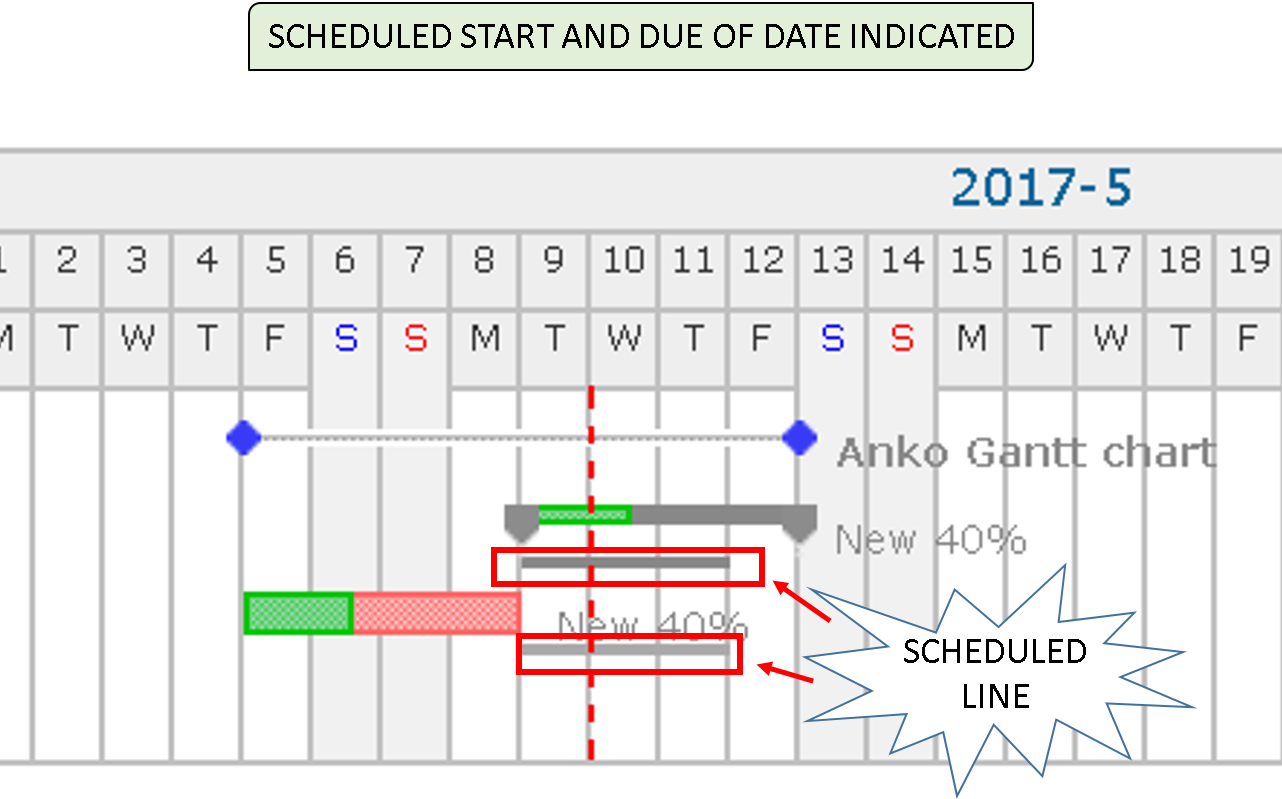
In Redmine's default Gantt chart, you can only view one timeline per issue. Once the start or due date is changed, the original schedule is lost.
ANKO Gantt Chart shows both the actual and scheduled dates, letting you visually compare progress with the original plan.
A thick line shows a Start and Due dates of an actual issue, and a thin line under it shows scheduled Start and Due dates.
SETTING ISSUES WITH PARENT ISSUES OR VERSION BY MOUSE DRAG
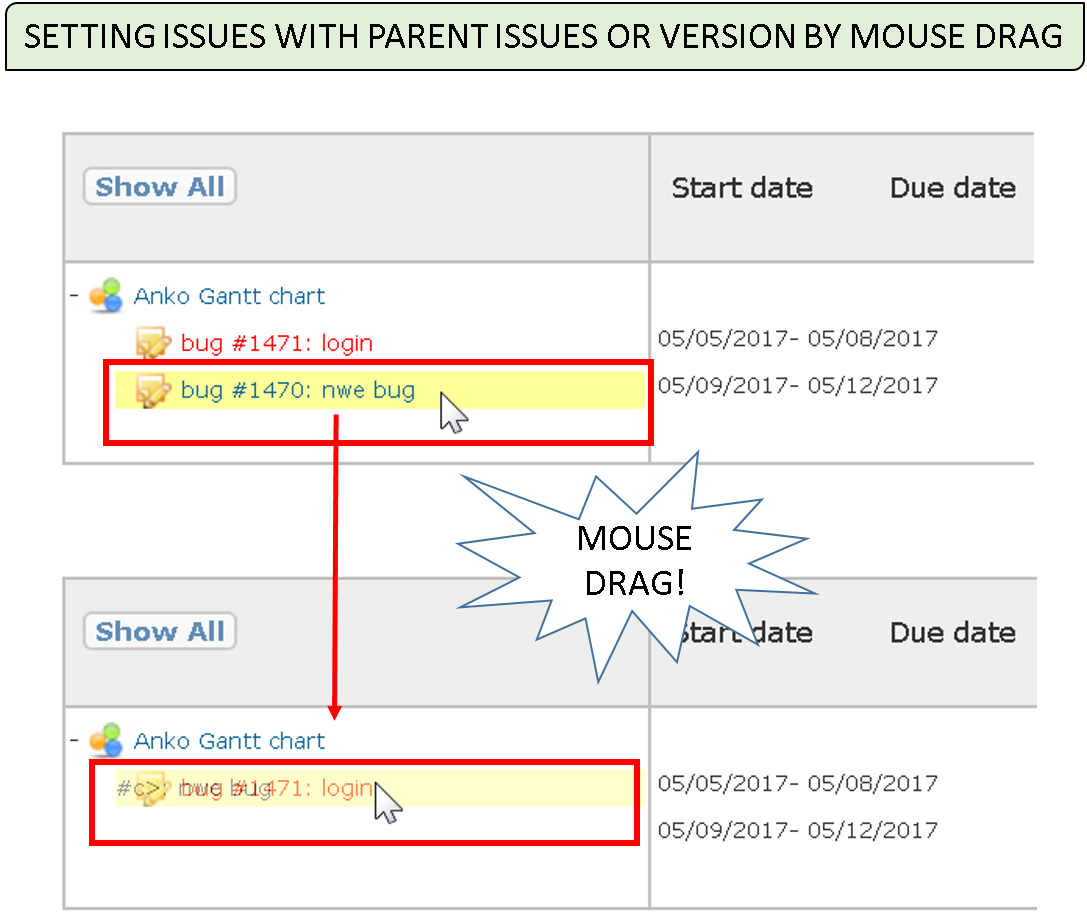
Assign parent issues or versions by simply dragging and dropping — easily build the structure of your project.
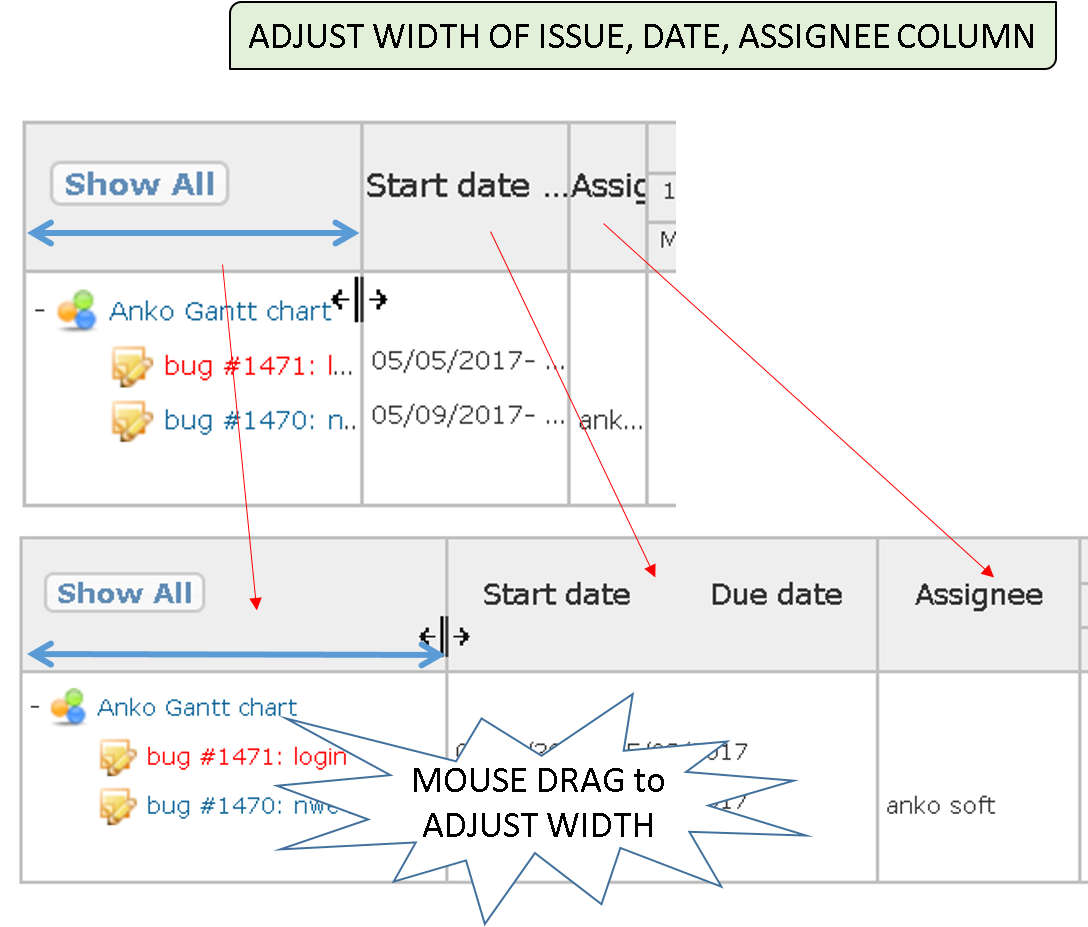
ADJUST WIDTH OF ISSUE TITLE, DATE, ASSIGNEE COLUMN
Hover over the edge of a column and drag to resize the issue title, date, or assignee columns.
You can also expand the display area of the Gantt Chart by narrowing the issue title column, date column, Assignee column.
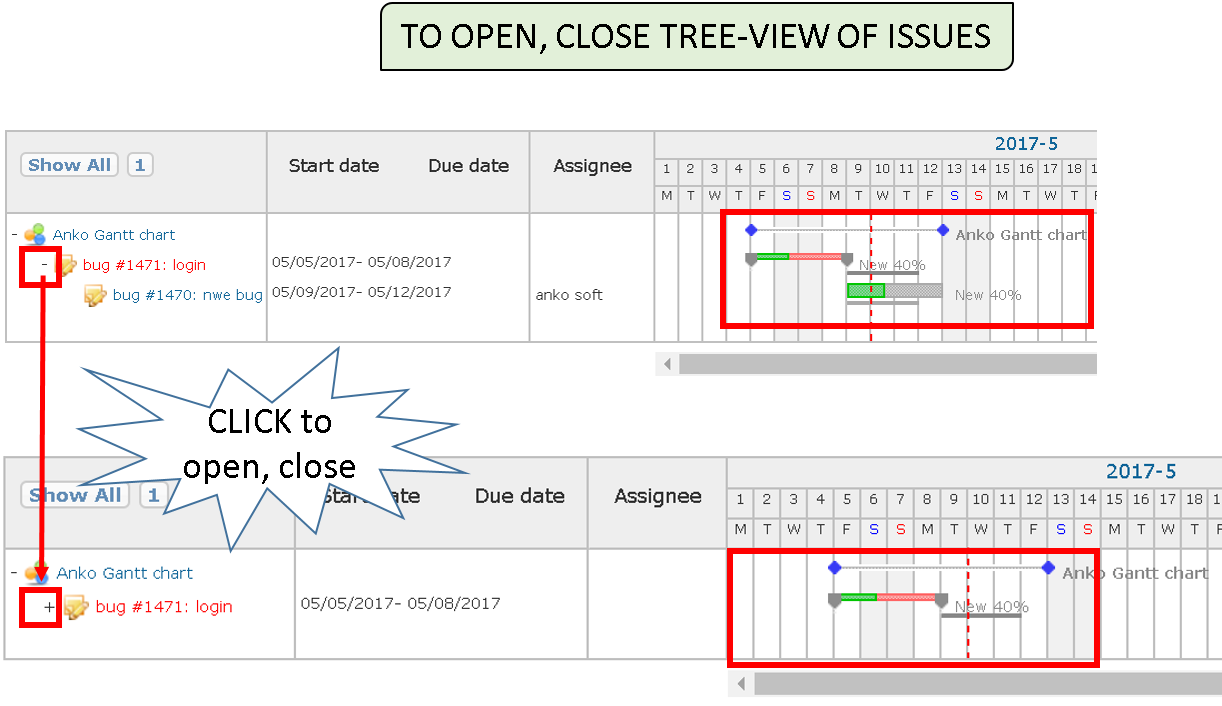
TO OPEN, CLOSE TREE-VIEW OF ISSUES
Click the “+” or “–” icon to expand or collapse the issue tree view.
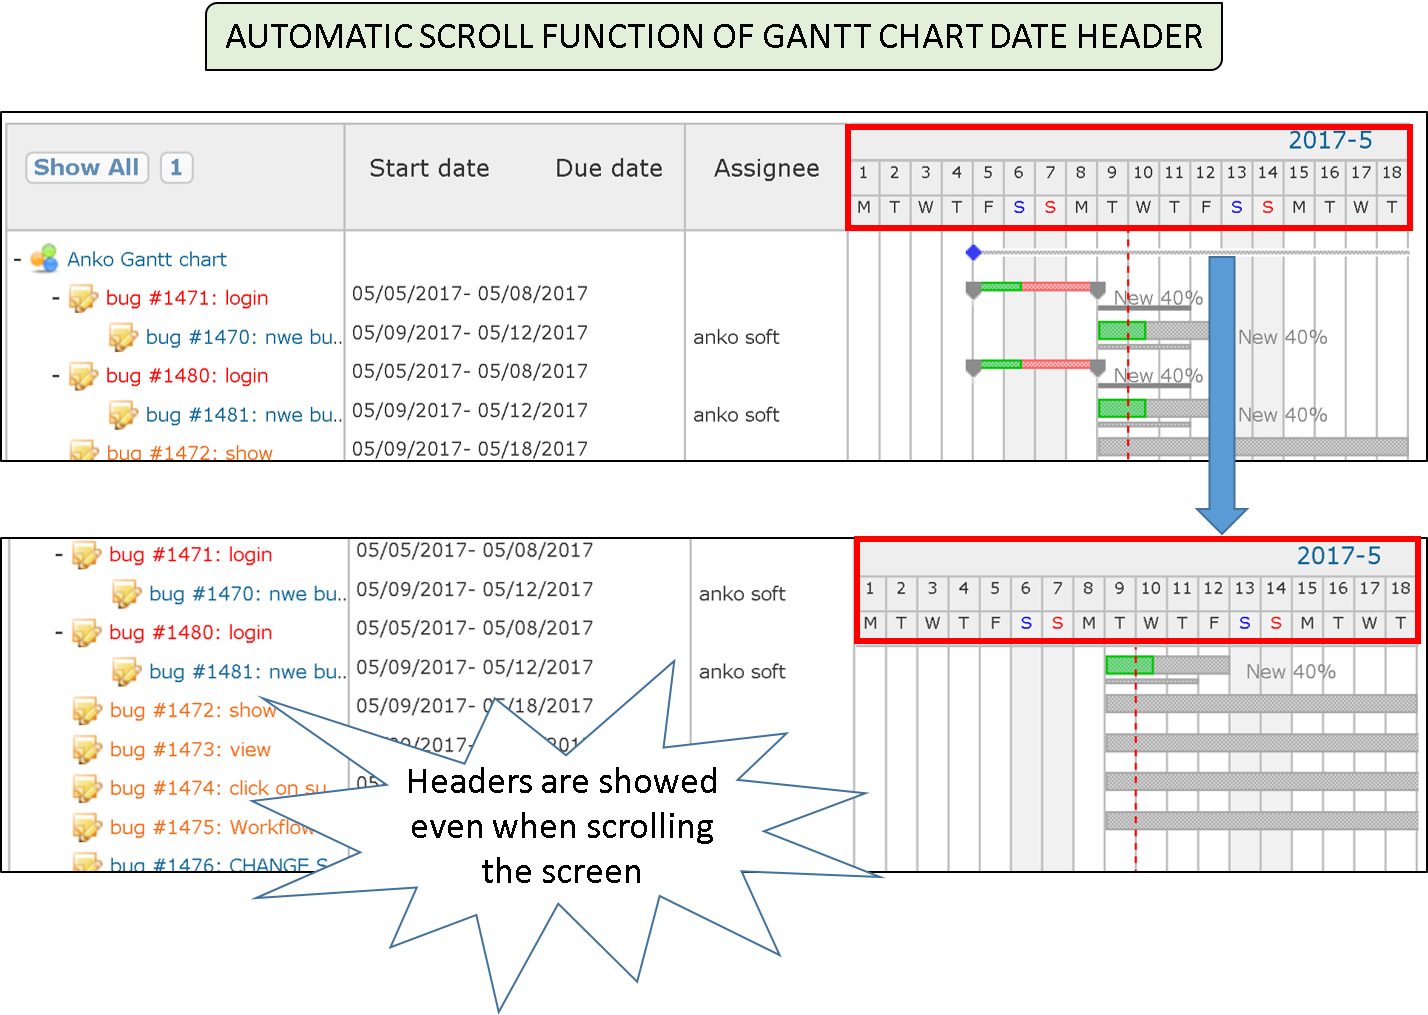
AUTOMATIC SCROLL FUNCTION OF GANTT CHART DATE HEADER
When there are many issues, you may need to scroll the page vertically. In the default Gantt chart, the date header disappears from view while scrolling, making it hard to track the schedule.
With this feature, the date header scrolls automatically, allowing you to keep track of dates at all times.
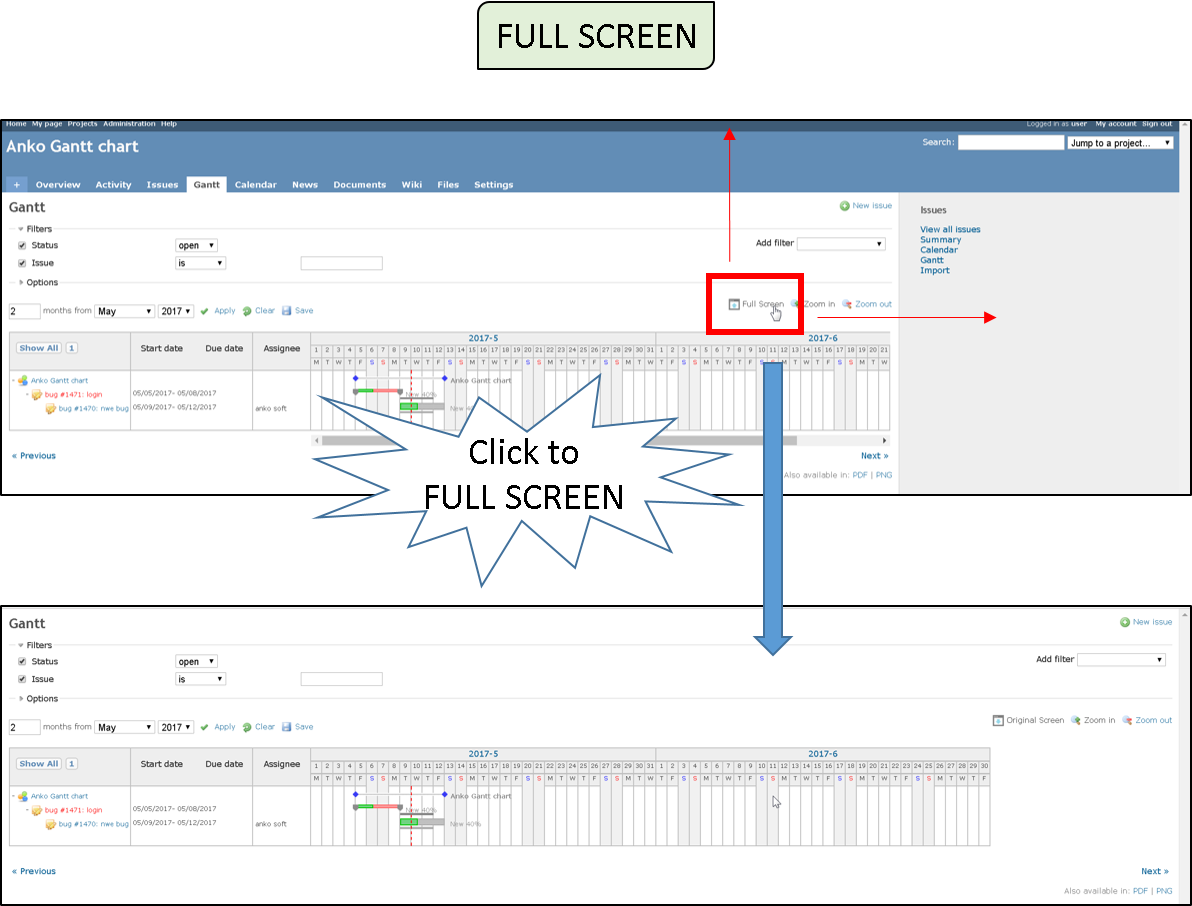
FULL SCREEN
To expand the Gantt chart drawing area, click the “Full Screen” button. The sidebar and header will be hidden, and the chart will be displayed in full screen.
Click the “Original Screen” button to return to the normal view easily.
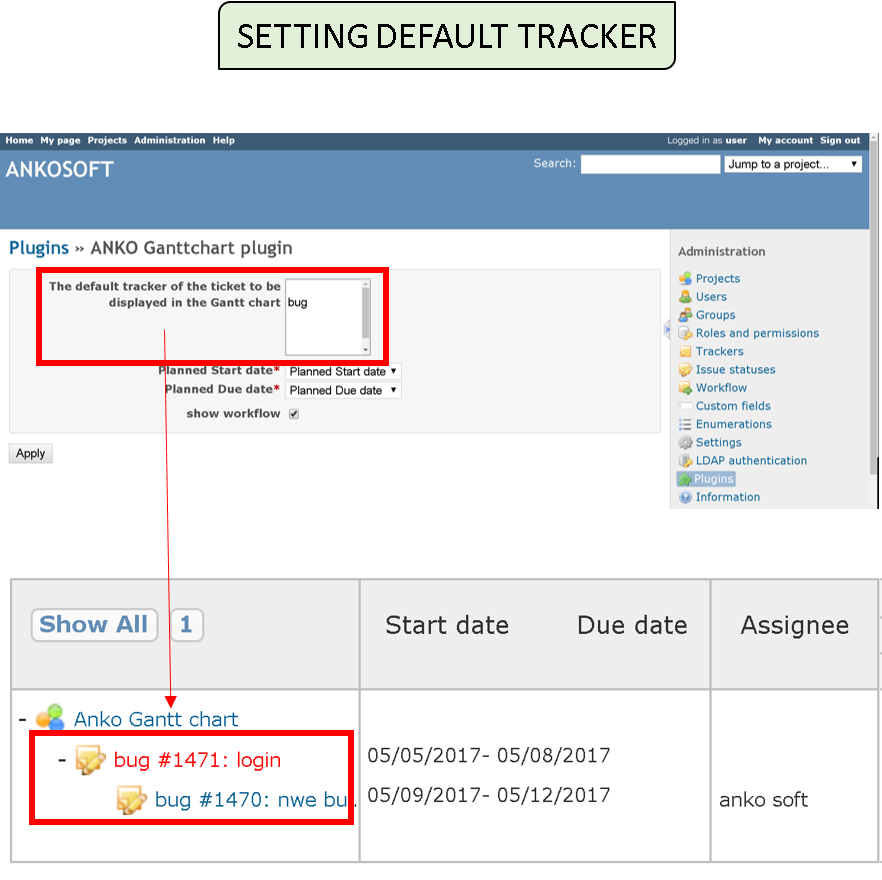
SETTING DEFAULT TRACKER
You can freely add trackers in Redmine to classify issues. However, displaying unnecessary issues in the Gantt chart may reduce readability.
By setting a default tracker, you can display only relevant issues, improving clarity and focus.
PROVIDE WITH A PLUGIN
ANKO Gantt Chart is provided as a plugin. It does not alter the database, so installation is simple.
Just copy the plugin files to the appropriate folder and restart your server. No changes to Redmine settings are required.
The plugin remains compatible even after Redmine upgrades, as it doesn’t modify the core system.
We provide you with a Plug-in, so you can use the Gantt chart page without any modifications.
You can use “Zoom in”, “Zoom out”, “Filters”, “Options” of Gantt Chart page same as
SPECIFICATION OF ANKO GANTT CHART
License: Server license (1 license per server, unlimited users and no time limit)
PRICE:$ 800 (U.S. $)
We offer a time-limited evaluation version that you can install on your server.
Please verify compatibility with your existing Redmine environment and plugins.
CONTACT US
Ankosoft Inc.
URL : http://www.ankosoft.co.jp/anko_gantt_chart_eng/
EMAIL : sales@ankosoft.co.jp
Changelog
3.2.24 (2025-07-17)
Compatible with Redmine 6.0.x, 5.1.x, 5.0.x, 4.2.x, 4.1.x, 4.0.x.
3.0.0 (2017-05-09)
Compatible with Redmine 3.3.x, 3.2.x, 3.1.x, 3.0.x.
2.1.3 (2016-08-03)
Compatible with Redmine 3.3.x, 3.2.x, 3.1.x, 3.0.x, 2.6.x, 2.5.x, 2.4.x.
2.1.1 (2016-07-01)
Compatible with Redmine 3.2.x, 3.1.x, 3.0.x, 2.6.x, 2.5.x, 2.4.x.
1.0.0 (2015-10-01)
Compatible with Redmine 3.2.x, 3.1.x, 3.0.x.